Are There too Many Immigrants in the UK? The Facts and Figures on Immigration
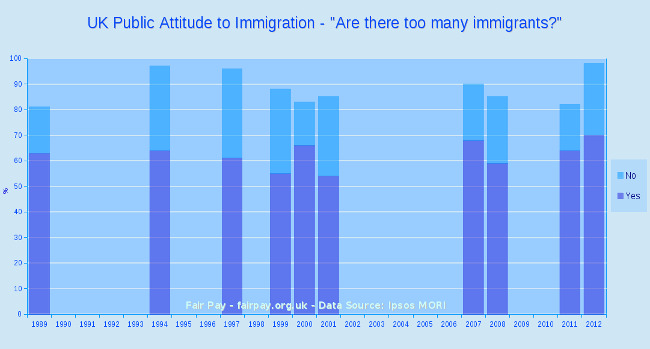
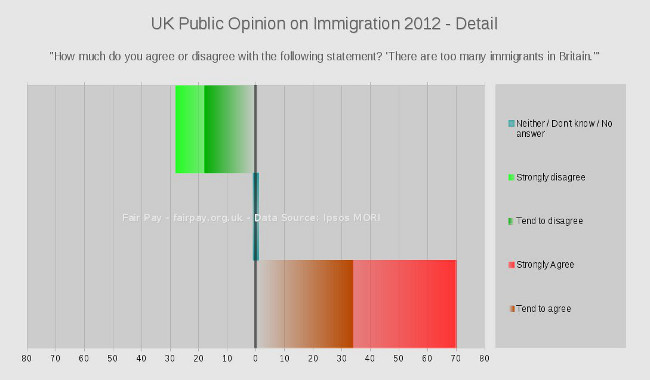
In a 2012 Ipsos MORI poll, 70% of respondents strongly agreed or tended to agree with the statement, "there are too many immigrants in Britain."This is the highest level of agreement in the 10 polls in this series available from Ipsos MORI, covering 1989 to 2012.
The details of the 2012 poll can be seen below:
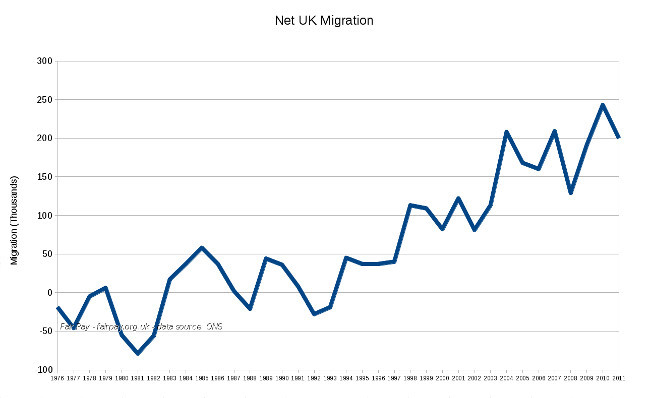
By historical standards, net migration (immigration minus emmigration) to the UK is at a relatively high level, reaching almost a quarter of a million people in 2010.
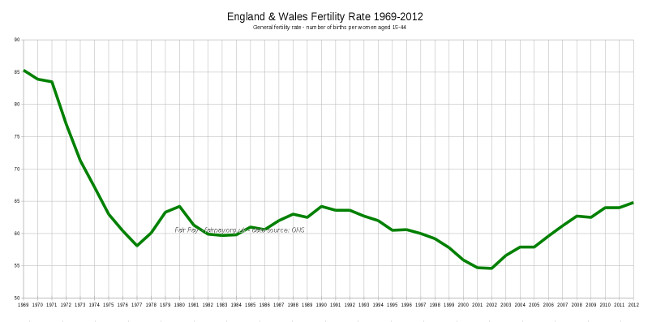
The other contributor to population levels - births - is at a relatively low level: 65 births per year per 1,000 women aged 15-44. However as the graph shows, it has been steadily increasing since 2002.
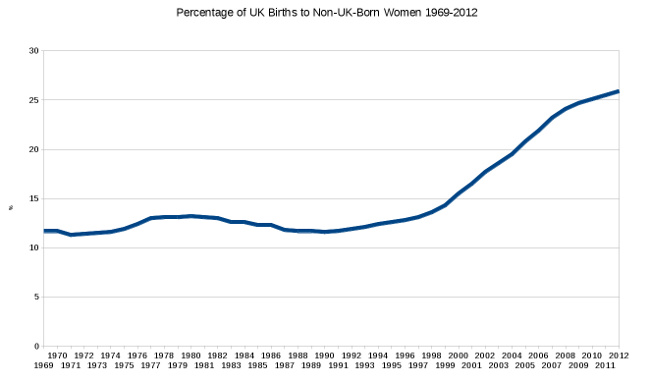
As might be expected from rising immigration figures, the proportion of those births coming from women who weren't born the UK has also been on the increase - now accounting for just over one quarter of all births in England and Wales:
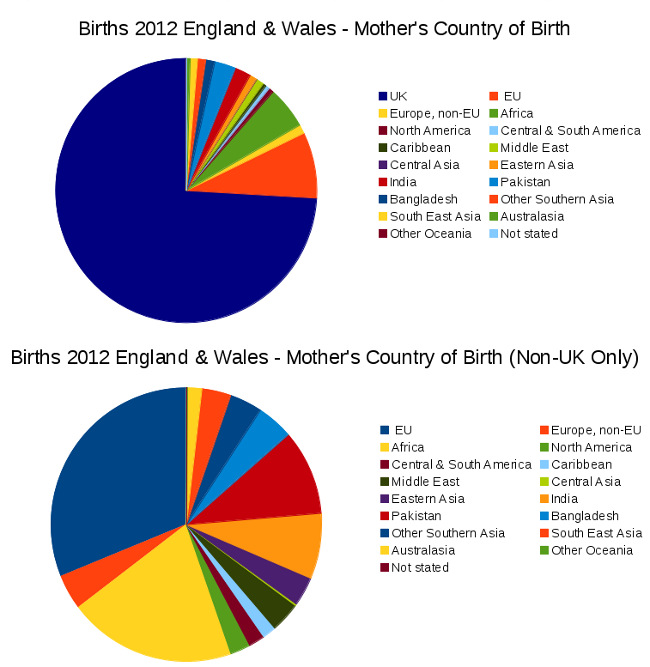
The country of origin of all mothers in 2012 is shown below, in the upper pie chart. The lower chart removes the UK-born element so that the proportions of the non-UK countries can be seen in greater detail. The continents of Europe and Asia are the largest contributors.
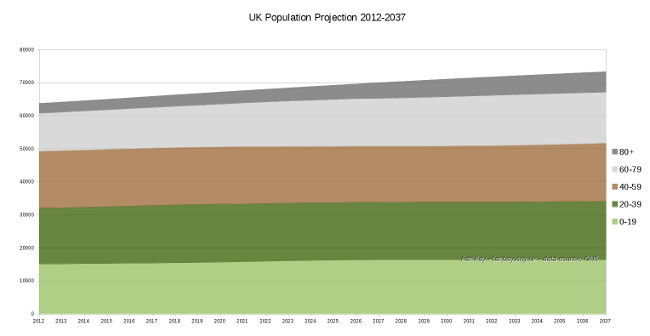
The Office for National Statistics estimates that the UK population will grow by about ten million people by 2037. According to this projection, most of this growth will be in the 60+ age group, while the other age groups remain fairly constant at around 50 million people.
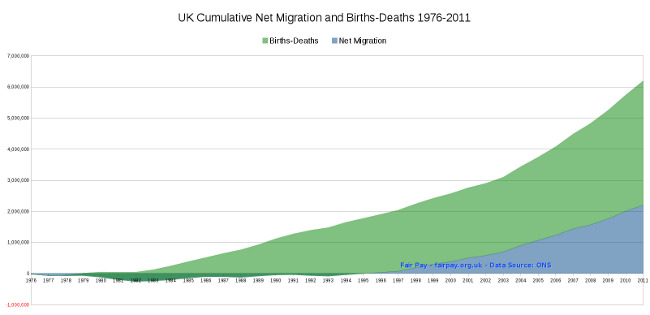
How much of the current population contribution comes from births, and how much from immigration? The cumulative figures from 1976 are shown below. This shows how much of the recent new population of the UK came from births minus deaths, and how much from net migration.
Since 1976 the population has grown by about 6 million people. Immigration is responsible for just over 2 million of that increase, while births account for the remainder.
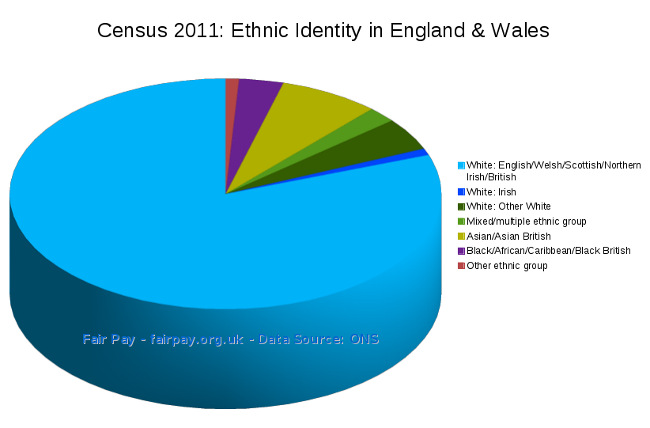
The current ethnic composition of the UK is shown below, based on the 2011 Census.
Data Sources
Public attitude to immigrant levels - Ipsos MORI - http://www.ipsos-mori.com/UK Net Migration - ONS - Link to original data no longer available. - Local copy of original data - Similar dataset from the ONS website, with data starting 1977 rather than 1976.
Fertility rates for England & Wales - ONS - http://www.ons.gov.uk/ons/rel/vsob1/birth-summary-tables--england-and-wales/2012/rft-births-summary-tables-2012.xls
UK Births & Deaths - ONS - http://www.ons.gov.uk/ons/rel/vsob1/vital-statistics--population-and-health-reference-tables/winter-2013-update/annual-table.xls
Statistics on births to mothers born outside the UK - ONS - http://www.ons.gov.uk/ons/publications/re-reference-tables.html?edition=tcm%3A77-320361
Population projection - ONS - http://www.ons.gov.uk/ons/rel/npp/national-population-projections/2012-based-projections/rft-table-a2-1-principal-projection---uk-population-in-age-groups.xls
Census population ethnic composition - ONS - http://www.nomisweb.co.uk/census/2011/lc2202ew
Edit 11/12/13: Mothers' country of origin pie charts' titles and related text corrected to 'England and Wales' (not UK).
Edit 08/01/14: Text above final pie chart (Ethnic Identity) corrected to "The current ethnic composition of England and Wales is shown..." (previously read, "The current ethnic composition of the UK is shown...").
Edit 25/08/18: Typo corrected, superfluous text removed.
Edit 15/05/19: Format of horizontal scale on Fertility graph corrected from date to year.


 Click to enlarge
 Click to enlarge
 Click to enlarge
 Click to enlarge
 Click to enlarge
 Click to enlarge
 Click to enlarge
 Click to enlarge
 Click to enlarge

