How an Ageing Population Affects Voting Power in the UK
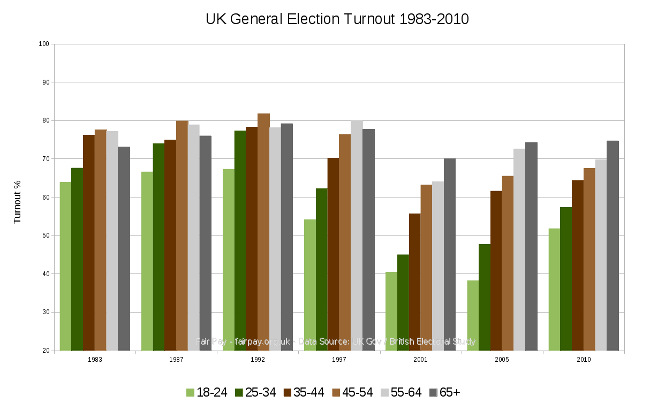
Younger age groups have less voting power and will have even less in future.The most obvious feature of this dataset is that voting turnout amongst the 18-34 group has been in decline since 1983, though it did start to pick up again for the 25-34 year olds in 2005 and for the 18-24 year olds in 2010. Turnout amongst the older age groups has remained consistently higher since 1997, and the difference is particularly noticeable in the 2001 and 2005 general elections.

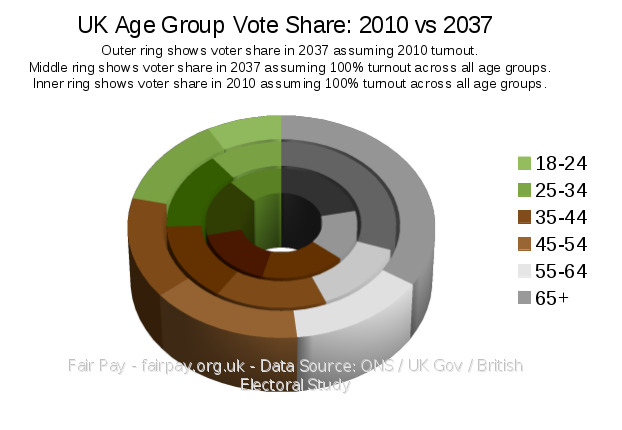
The chart above shows voting share across the age groups in 2010 assuming 100% turnout across all age groups. It also shows voting share in 2037 in two different scenarios - 100% turnout across all ages (inner ring), and turnout based on real data from 2010. It can be seen that the older age groups' share of the vote is set to considerably increase (middle ring), and this effect is further magnified if the younger age groups continue to vote less than their elders, as they did in 2010 (outer ring). In the latter case, the 55+ age group would control just under half of the nation's voting power.
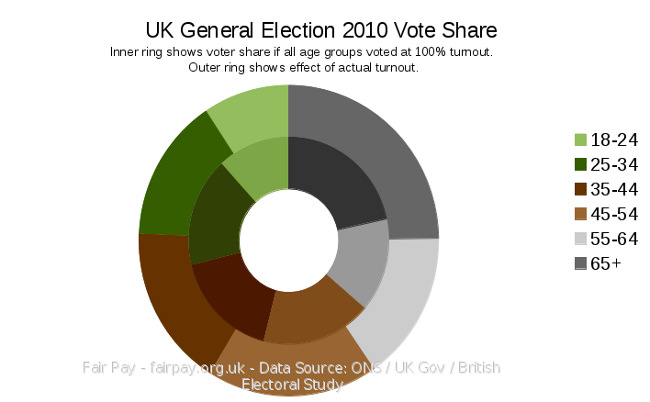
The final chart, below, highlights the effect of the current disparity in turnout on voting share, contrasting the voting share given by the real 2010 general election turnout with a scenario in which all age groups vote at 100% turnout.

Notes on the Data
The age intervals in the population projection figures do not correspond exactly with those in the voter turnout data. Specifically, the closest equivalent to the turnout data's 18-24 interval in the population figures is 15-19 and 20-24. The population data has therefore been remapped to the intervals used in the turnout data. In recalculating the figures, the 20-24 interval has been taken and added to two fifths of the 15-19, using an underlying assumption that the population is evenly spread between the ages in the interval. This assumption is unlikely to be correct, but the level of error should be acceptable for the purposes of this analysis.Population levels and composition from 2012 have been used in calculating turnout figures.
Data Sources
Population projection - ONSVoter turnout - UK Government / British Election Study [PDF]


 Click to enlarge
