UK Home Ownership, House Prices and Wages: Prices Rising, Ownership Falling
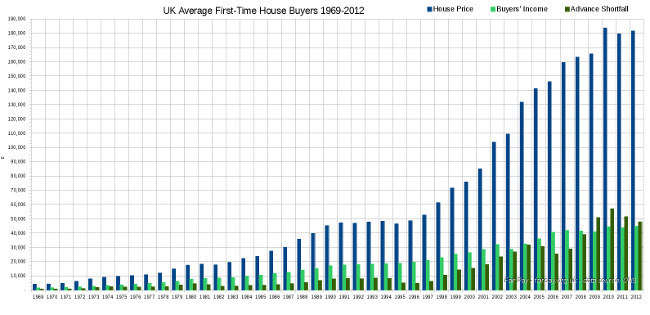
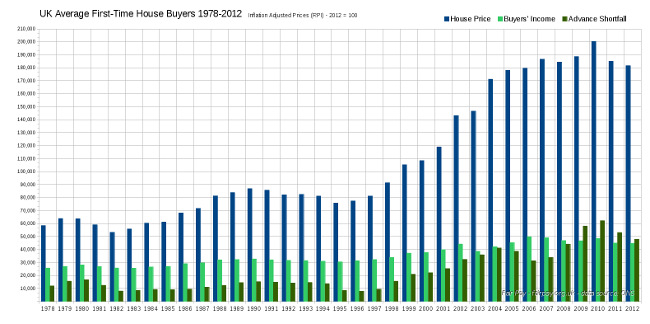
The price of a home has been rising faster than wages. Ownership levels are dropping.The chart above shows that house prices for first-time buyers have massively inflated between 1969 and 2012. Not only have prices increased, but they have become more unaffordable. In 1969 the average home cost just over £4,000, against an average buyers' wage of £1,600 (price: 2.5 times income). By 2012, the price had increased to almost £182,000 against a buyers' wage of just under £45,000 (price: 4 times income). The following graph shows the same data between 1978-2012, adjusted for inflation using 2012 as the basis.
This clearly shows that average first-time house prices have been accelerating beyond wages for some time.
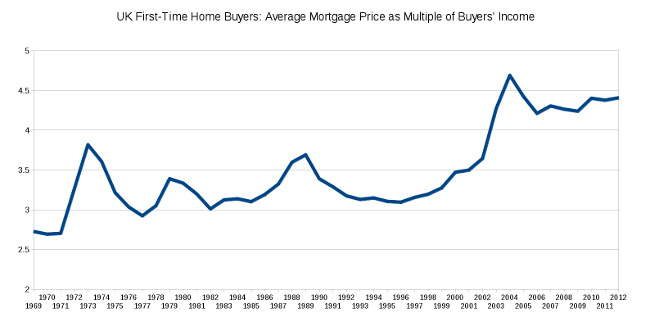
The multiple of house prices vs. wages between 1969 and 2012 is shown below. While the overall trend is upwards, the most significant increase was between roughly 2001 and 2006.
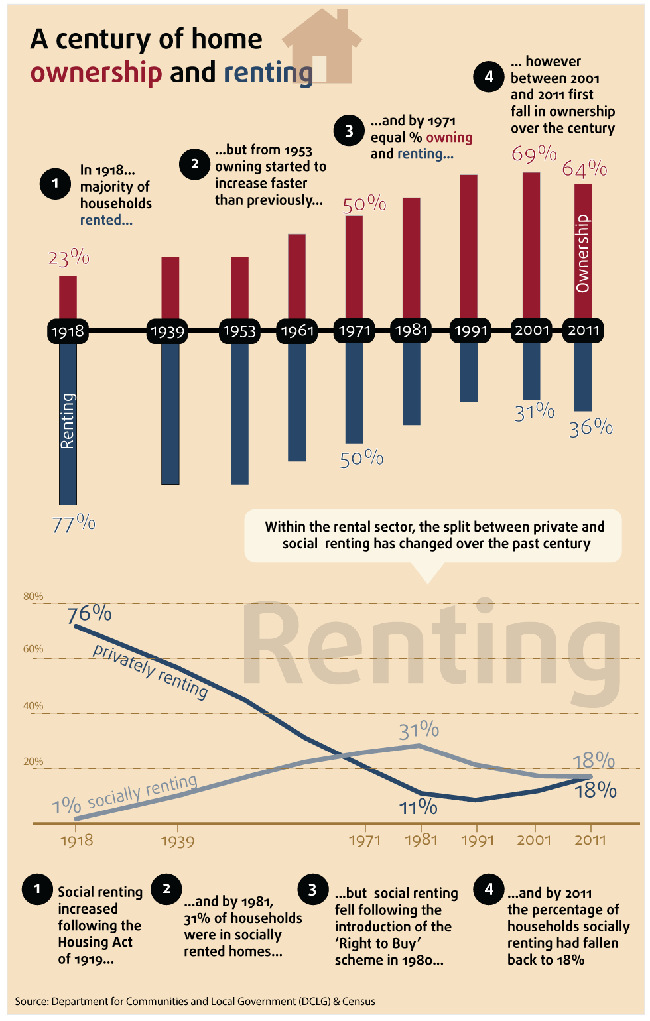
Note that this graph is based on the ONS' figures for first time buyers, and their wages. It therefore has an inherent bias and quirk - only the wages of people who can afford to buy houses make it into the comparison, and it's presumably usually the combined wages of two people. The real multiple of average wage vs. average house price is likely to be considerably higher. As might be expected from this situation, home ownership in the UK is dropping, as this infographic from the ONS shows:
Notes on the Data
The measure of inflation used in recalculating house price data is the Retail Price Index. Previous years' incomes and prices have been adjusted to 2012 equivalents.Data Sources
Inflation Data: ONS Consumer Price Inflation Reference Tables, October 2013 - Table 49House price data: ONS Regulated Mortgage Survey
ONS - A Century of Home Ownership and Renting in England and Wales


 Click to enlarge
 Click to enlarge
 Click to enlarge
 Click to enlarge

