A list of around 1,000 companies with vacancies in the Yorkshire, Tyneside, Teesside / Tees Valley, Northumberland and Leeds areas.
The list is split into two tables: the first contains charities, education and public sector organisations. The second table lists private sector companies.
Where given, company sizes are measured by the number of people they employ. This figure usually includes all employees of the company, or parent company - not just those employed in the North East.
A few companies are listed but carry no links - these are organisations that I estimate should have a significant recruitment effort (based on turnover and number of employees), but I can find no website or recruitment link on their website.
The linked websites are checked regularly for phishing, viruses and malware and any infected links are removed when found. Companies who only offer low-quality jobs such as unpaid internships, commission-only sales or work-at-home piecework will not be included. Minimum company size is generally 50+ employees and £1M+ turnover, however exceptions are made where future expansion seems likely or where the company works in an area where jobs are scarce in the North East.
The list is not exhaustive. Suggestions for new additions or corrections are welcome.
Unfortunately, many of the websites linked to below require Javascript enabled to function correctly.
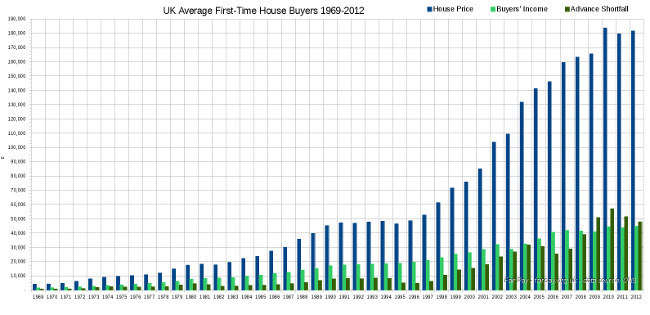
The chart above shows that house prices for first-time buyers have massively inflated between 1969 and 2012. Not only have prices increased, but they have become more unaffordable. In 1969 the average home cost just over £4,000, against an average buyers' wage of £1,600 (price: 2.5 times income). By 2012, the price had increased to almost £182,000 against a buyers' wage of just under £45,000 (price: 4 times income). The following graph shows the same data between 1978-2012, adjusted for inflation using 2012 as the basis.
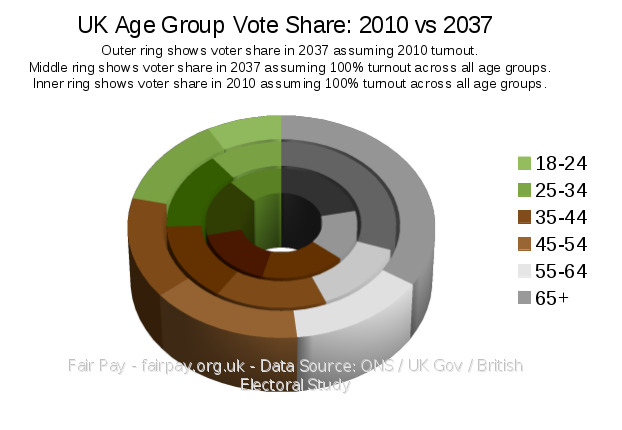
The most obvious feature of this dataset is that voting turnout amongst the 18-34 group has been in decline since 1983, though it did start to pick up again for the 25-34 year olds in 2005 and for the 18-24 year olds in 2010. Turnout amongst the older age groups has remained consistently higher since 1997, and the difference is particularly noticeable in the 2001 and 2005 general elections.
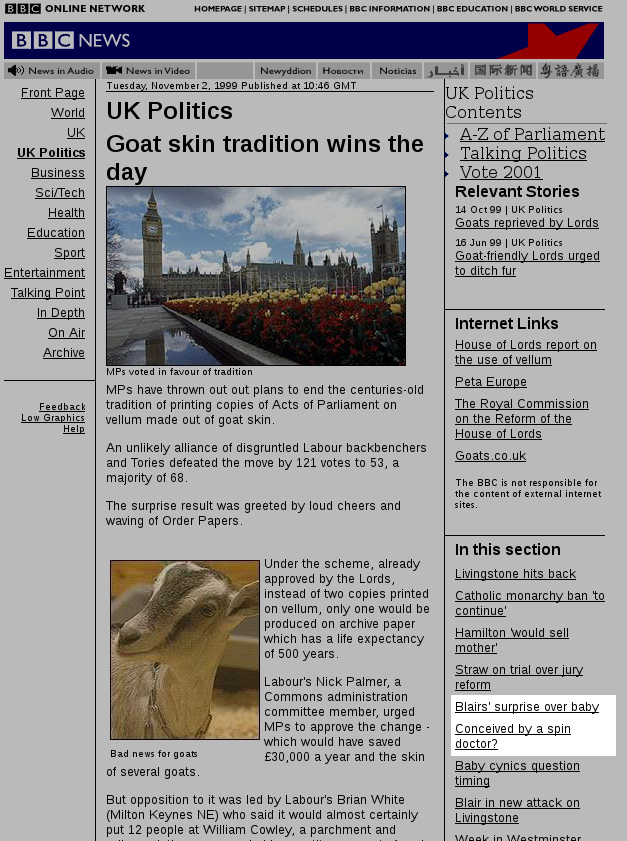
Was one of Tony Blair's children actually fathered by a New Labour spin doctor?
One of the common tricks that the media appear to get up to is putting different headlines together to make a suggestion (follow the link to the original page, or scroll down to view a screenshot). In this case, the headline, “Blairs' surprise over baby” is butted up against “Conceived by a spin doctor?”
All things considered, I'd guess this suggestion isn't true and isn't serious bullying. As far as I know New Labour weren't particularly hostile to the BBC in 1999, that being only two years after their big victory in 1997, and long before what looked like serious political warfare between New Labour and the media around the time of the Iraq War.
If this is anything, it's probably just a bit of silly joshing from the politics journos. It might not even be that – it might just be a coincidence that those two headlines ended up like that. I sometimes look at the pictures and links to other pieces that appear below each of my articles and notice that the choice doesn't seem random. And yet it is. With one brief exception some time ago, and some of the links that appear in the 'National View' section, the related content sections are all still operating in random mode, choosing from other articles related by subject. I've always tended to shy away from deliberately using subtext at all, if only because other people are so much better at it than me.
However, it still makes for a nice, basic example of one of the ways the press can psychologically pick away at someone and get away with it.
There were over 28,000 different boys' names and over 36,000 different girls' names spread over 729,674 births. The top 10 names account for 13% of all names. The names are listed in order of popularity (most popular to least popular).
Boys
Harry Oliver Jack Charlie Jacob Thomas Alfie Riley William
HICP / CPI Inflation figures for 27 EU countries 2005-2012
The graph below shows cumulative inflation levels for each of the EU countries available from the Office for National Statistics. The inflation index used is the HICP - the Harmonised Index of Consumer Prices (CPI in the UK).
The group of countries experiencing higher inflation over this period mainly consists of EU countries that have not joined the single currency - Bulgaria, Hungary, Latvia, Lithuania and Romania. The exception in this group is the newest addition to the Eurozone, Estonia, which adopted the Euro in 2011.
The following graph shows the same data with an adjusted scale on the Y-axis to show the lower-inflation group of countries in greater detail.
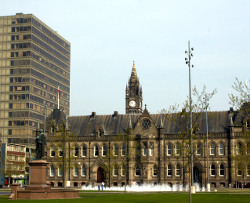
Exciting Times: Up to half of council's employees to be sacked due to budget savings - consultation to be opened.
The Northern Echo and Evening Gazette report that Middlesbrough must save an additional £11M on top of previous cost-saving estimates, which may result in the loss of up to 1,500 employees - over half the number of people currently working at the council (2,500).
In a subsequent article, the Northern Echo reports that 600 jobs have already been lost since 2010.
Looking at the Council's own 'employment details' figures published on their website, we can see that they have indeed reduced their headcount by 554. However, measured in terms of full-time jobs, the number of people employed has actually only reduced by 227 (Note: figures don't include school staff.)


 Click to enlarge

 Click to enlarge

 Click to visit original page


 Click to enlarge
 Click to enlarge